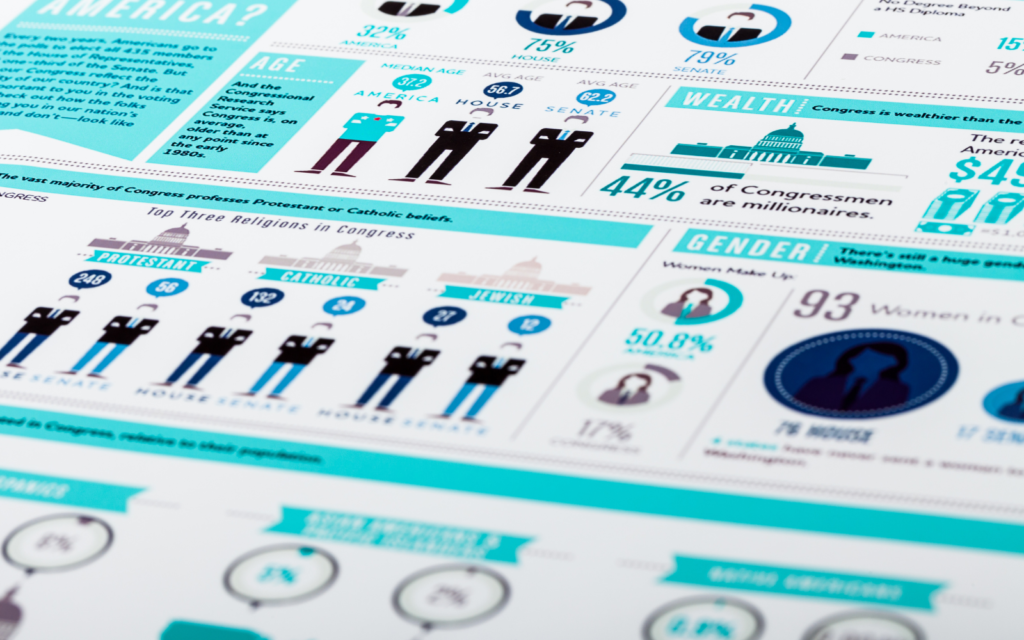
Sometimes, your content needs a visual element to draw in your audience and stand out in their minds. An infographic could be just the thing you need to convey your statistics or tips in a visually appealing way, making shareable content for your audience. How can you create an infographic that stands out in a sea of other content?
There are tons of tips and tools you can use, including infographic templates, that make assembling this image a breeze. This guide will walk you through everything you need to know when it comes to your infographic design.
Let’s get started!
Why Should You Create an Infographic?

Before we dive into making a standout infographic, it’s important to know why this method appeals to your brand and your marketing efforts. Data visualization is key for just about any business, with the rates of usage steadily increasing over the years. Roughly half of all marketers claimed that visual elements were an important part of their advertising efforts.
Plus, it may even lead your customers to make faster decisions about whether they want to opt in for your product or service. According to Search Engine Journal, people process infographics faster, which means they also make decisions faster.
Get your content out to more people by creating your own infographic. People are far more likely to share a visually appealing infographic with their friends on social media and other sources than for boring text-only content.
6 Tips to Create Infographics that Stand Out
Creating an infographic online is easy, but there are some topics we need to cover before you start downloading infographic templates. Here are the six tips you should keep in mind when creating an infographic.
1. Define Goals for Your Infographics
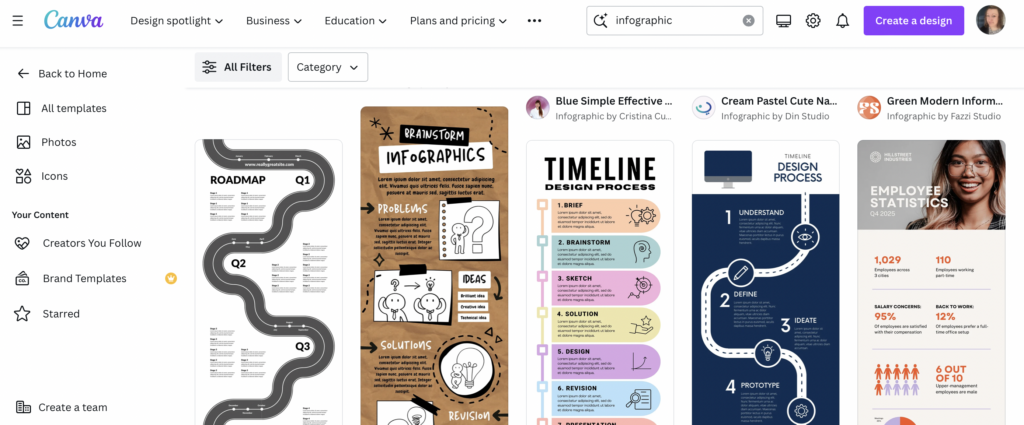
An infographic maker won’t be much help to you if you don’t have a clear idea of what your visual should accomplish. From the start of the design process, know exactly why you want to create an infographic and how it will benefit your audience.
Here are a few goals you may want to accomplish with your data visualization:
- Share a step-by-step process to achieve a goal.
- Create a timeline infographic to show how clients can work with you.
- Summarize key data that represents your industry as a whole.
- Relay survey data that you created on your own.
- Summarize a longer piece of content with a bite-sized synopsis at a quick glance.
- Raise awareness.
2. Pinpoint Your Target Audience and Platform

Infographic design isn’t a one-size-fits-all approach for every business. There are tons of formats and infographic templates out there to give you a polished visual representation of your data. Where will you share your infographic online?
For example, different social media platforms require different sizes for their images. A long and narrow infographic may not work best on Instagram, where most images are cropped to a square. If you will be sharing it on your blog post, dimensions may be less of an issue.
Know where your audience hangs out before you start using any free online infographic maker.

When you create infographics, you want to share more than just a single statistic. Data visualization works best when you are revealing lots of new insights about a particular topic. Some companies may already have their data compiled, but others will need to do research via sites like Google Scholar.
Research is a key part of making the most of professionally designed infographic templates.
Sometimes, you might be walking your audience through a step-by-step process that you implement with your customers. This doesn’t require much research, but you do need to get clear on the process before you start creating your infographics.
4. Download an Infographic Template or Work on Online Tools
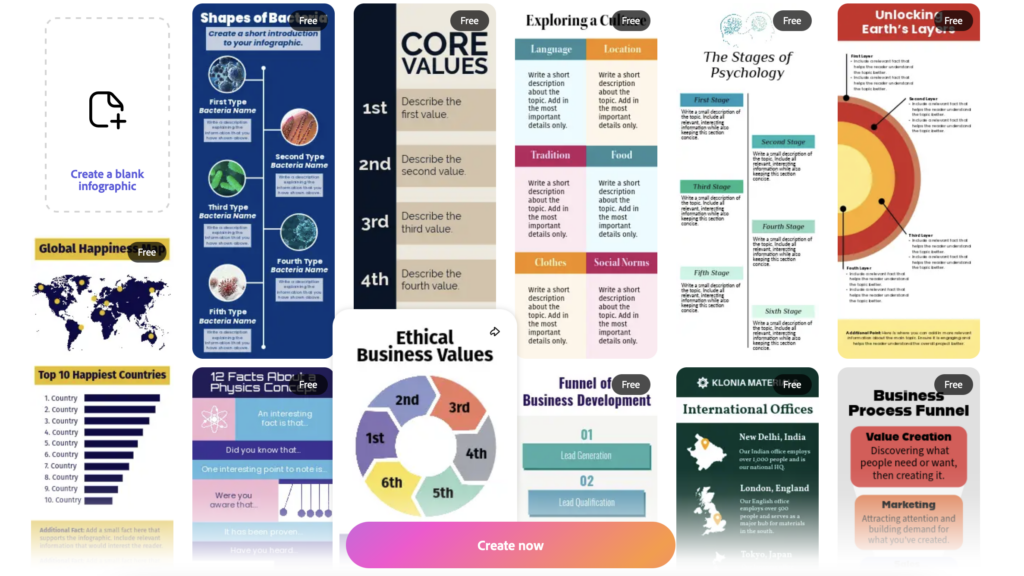
Infographic design is the fun part of the process. Fortunately, there are lots of tools out there that can help you come up with an image that stands out. Professional infographic templates might be a great first choice if you want to modify them and make them work for you.
If you already have tools in your company wheelhouse to create images, then you may want to select free infographic templates. You can modify these on programs like Microsoft PowerPoint or Canva (more on these tools in a little bit).
Companies that don’t have any tools at their disposal can still create engaging infographics without spending a fortune. You don’t need to hire another company to make your own custom infographic. Instead, you can invest a little sweat equity into using free tools online (like Adobe Express).
5. Cite Your Sources
When you use your own data in the infographic creation process, you may not need to cite any sources. However, you will want to share where you gathered your data from if it came from a third-party site you found on Google Scholar or anywhere else.
Sources can be included at the bottom of your infographic template in small print. This gives people the opportunity to explore the topic further if they want to without disrupting stunning infographics. People expect to see some research on professional infographics, and they may not feel like yours is reputable without sharing this information.
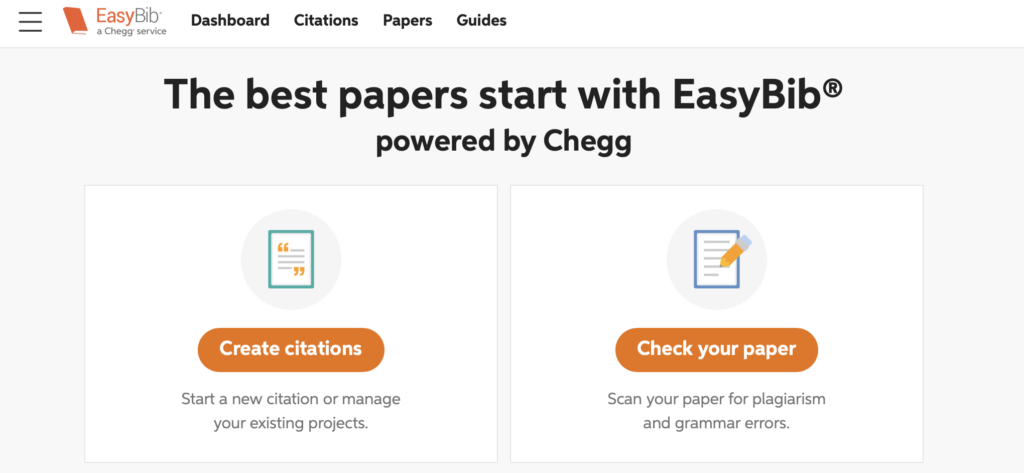
Plus, it’s plagiarism to steal data and research from someone else and claim it as your own! Use sites like Easybib to write your citations.

Now that you have created your own infographic, it’s time to release it out into the world! This is one of the most exciting parts because you can see the reaction other people have to your data visualization. No matter what infographic tool you use for creation, you have a beautiful image to share with your audience — and you may even gain new audience members because of it.
Consider all of the places where you might be able to share your free infographic:
- Social media (Facebook, Instagram, and X are great places to start.)
- Blogs (which can also be shared on social media)
- On your website
- Flyers
- Brochures
Whether you want to help your customers visualize data in digital formats or print, there are tons of great places to share your interactive infographics. Get creative and make your image work harder for your brand by posting it everywhere you can think of. You spent time on its design elements, so you should be proud to share it!
Finding a free infographic maker is easier than you might think. This has become a commonplace way to share information with others, and online tools have taken notice.
Here are five places you can look to for design help, whether you want an interactive tool or free templates.
Canva
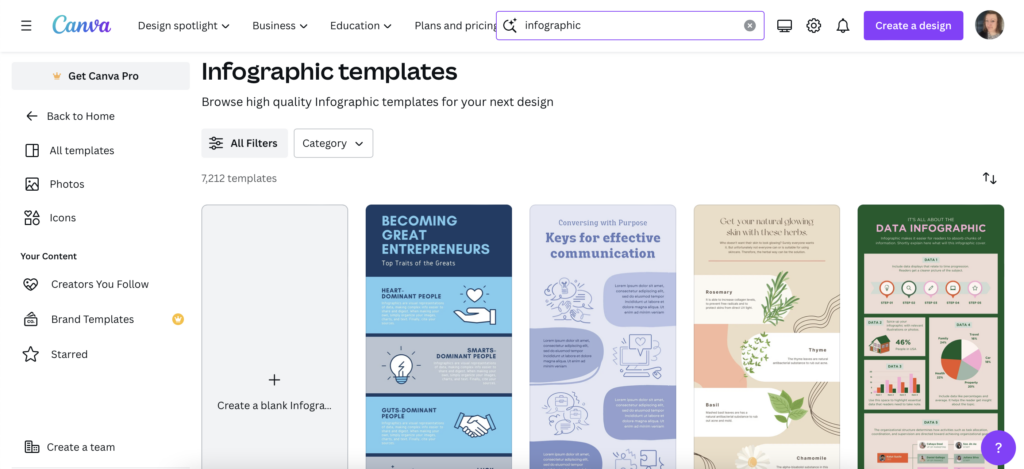
Is there anything Canva can’t do? When you need an infographic maker that won’t cost you a dime, this is a great place to start. They have professional infographic templates that you can customize with just a few clicks. When you want to create infographics the easy way, you can use their templates for a:
- Step-by-step process
- Timeline infographic
- Data and charts
- Statistics
- Fun facts
Even if you don’t find an infographic template that you want to use, it’s easy to build an entirely new layout from scratch. Just use their drag-and-drop editor to put your pictures and text in just the right spots. Their free infographic templates are great for anyone who doesn’t want to pay for services they might not use regularly.
Be sure to check out our full Canva review here!
PowerPoint
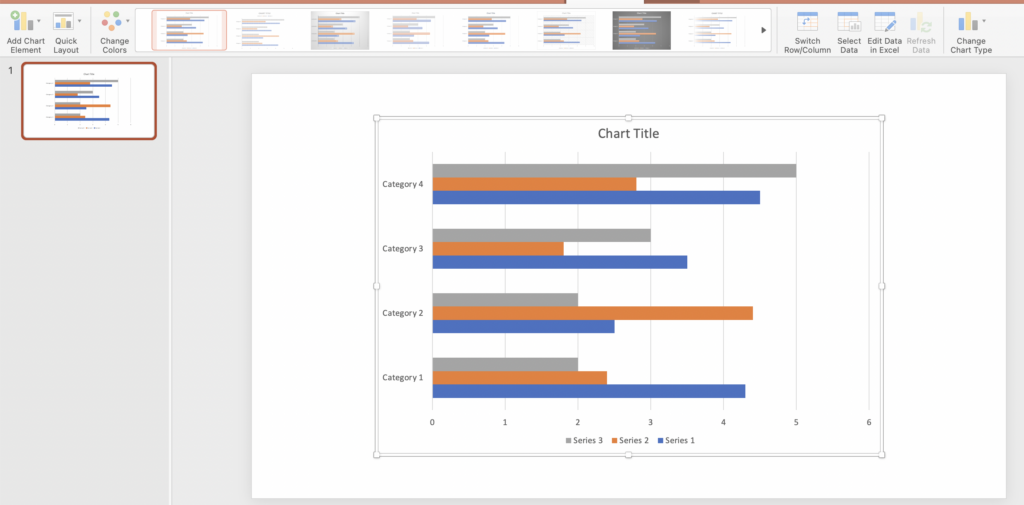
Another great place to turn to modify infographic templates is a program you may already have: Microsoft PowerPoint. When you already have this tool, it’s a great option for infographic design because it’s simple to use with a minimal learning curve.
PowerPoint is great for presentations and can be customized more than a simple infographic template you find online (though we’ll cover more of these in a minute). Their infographic maker can be used in just a few simple steps:
- Open up a blank slide and change it to portrait mode.
- Create your title text (including a subtitle, if you want).
- Use SmartArt to create charts, graphs, and other visual elements.
- Add your text and images to flesh out the other design elements.
If you want to make an infographic completely on your own using custom design elements, then this is the way to go. It’s quick and easy and makes the most of programs you already own or pay for. A free infographic maker never looked easier!
Adobe Express
Some people want to make an infographic using the Adobe suite of products, but they don’t want to pay the hefty cost of Adobe Illustrator. Adobe Express is a great option for a free infographic maker that can be customized, just like Canva.
You never have to enter a credit card to gain access to Adobe’s most basic plan. Use Adobe Express for processes, a timeline infographic, and more with their robust selection of free templates.
All you have to do is select your desired infographic template and get to work. The tool allows you to visualize data quickly and easily, modify images to suit you, and update the colors with your branding. Nobody will be able to tell that this isn’t a custom infographic by the time you finish with it.
Here are some other Adobe alternatives if you don’t want to pay for their suite of tools.
LucidChart
LucidChart is another great free infographic maker, but the free plan is a little more restricted than their low-cost plan. Still, it’s a great starting point if you want to make an infographic for the first time and aren’t sure how much you’ll want to use it moving forward. Get started for free or upgrade to an individual plan for $7.95.
They give you 100 free templates to create beautiful infographics of all kinds. The free infographic creator allows you to have three editable documents with up to 60 shapes each. You can access more templates, such as timeline infographics, with a paid plan.
It’s a drag-and-drop editor just like Canva, and it has powerful data visualizations so you can link your statistics with their charts and diagrams.
Download Templates from Hubspot
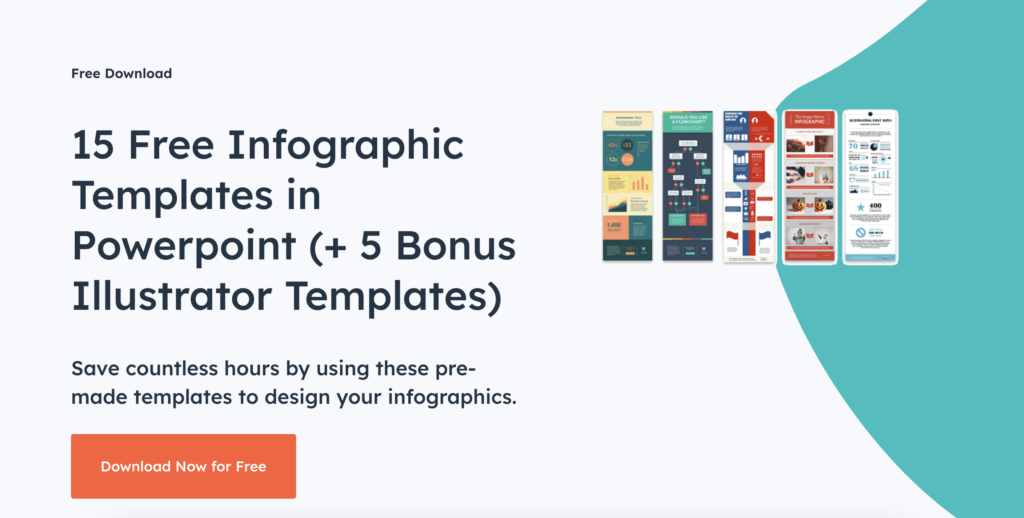
If you think you can make an infographic with more of a DIY approach, Hubspot features a great option for an infographic template. Their infographic maker allows you to download fifteen templates that can be uploaded to PowerPoint and customized from there. If you don’t have PowerPoint, you can also upload these templates to Adobe Illustrator.
What you can edit or change with this infographic template is practically limitless. You can create your own color scheme to match your branding, use specific fonts, or work within the confines of a theme that appeals to you. An infographic maker like this opens you up to all sorts of possibilities!
They serve as a great foundation for anyone who wants to create an infographic but feels overwhelmed starting from scratch. You can use some of the same tools mentioned previously for customization by using these as a starting point.
Final Thoughts: Is It Worthwhile to Create an Infographic?
Data visualization is key to generating more traffic. According to Hubspot, businesses that leverage infographics grow 12 percent more than those who don’t utilize these tools. A growing business needs to start using an infographic template that bolsters its brand or a free infographic maker that allows it to make informative infographics.
If you want to create impactful infographics, consider using an infographic creator like those listed above today.
Be sure to see our other article here on other types of blog content that can grow your site and brand!

